 As advancements in medical technology continue to shape the healthcare landscape, DexCom, Inc. (DXCM) stands out with its innovative continuous glucose monitoring solutions. Recent price action suggests that DXCM’s stock price has triggered a potentially new bullish run. In this article, I will examine the technical and fundamental factors behind this positive outlook and outline a risk-defined options strategy — all identified via the OptionsPlay Strategy Center within StockCharts.com.
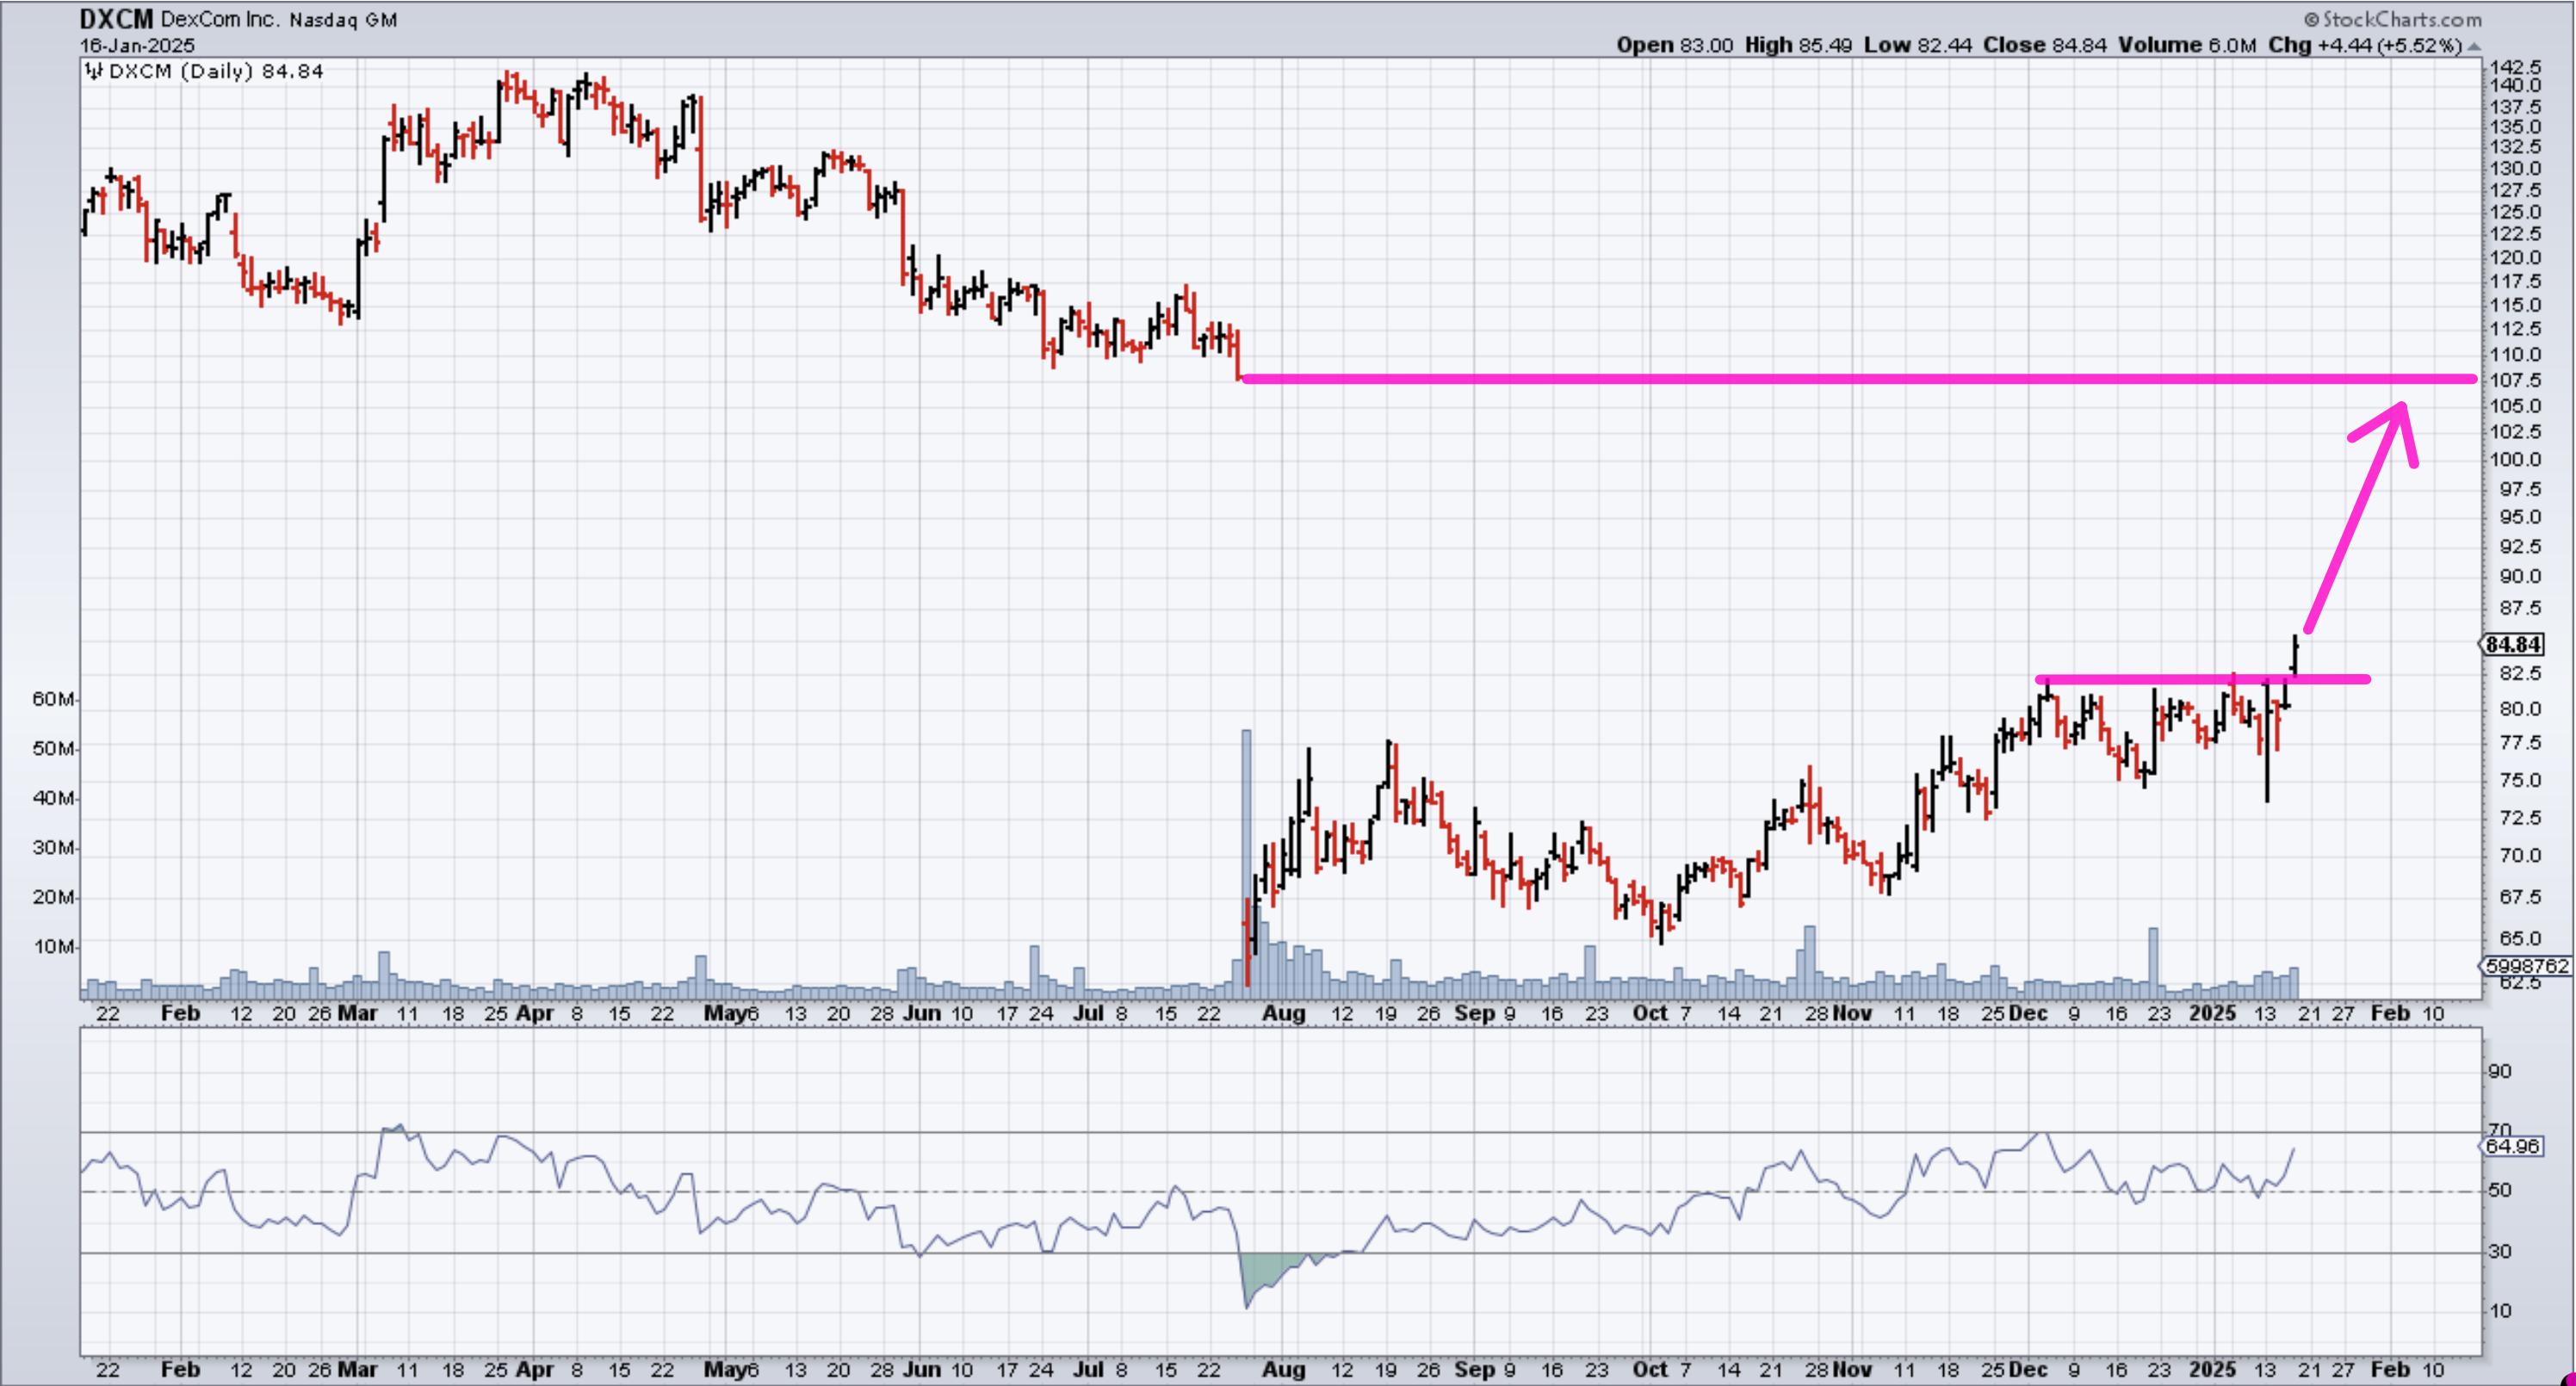
After consolidating between $75 and $80 over the past two months, DXCM’s stock price recently broke out of this trading range with impressive relative strength.
- Range Breakout. The stock’s breakout above $80 marks a decisive breakout from its consolidation zone.
- Outperformance. The breakout has been coupled with outperformance to the S&P 500.
- Upside Target. Given the breakout, there is potential for DXCM’s stock price to fill the gap up to the $107.50 level.

FIGURE 1. DAILY CHART OF DXCM STOCK. The stock price traded between $75 and $80 since the end of November. DXCM recently broke out of its consolidation zone and traded above $80.Chart source: StockCharts.com. For educational purposes.
Beyond the charts, DXCM’s fundamentals support its premium valuation:
- Premium but justified. While trading at 39x forward earnings, DXCM’s superior growth expectations and higher net margins than peers suggest that this valuation is justified.
- Potential for substantial upside. Robust demand in the continuous glucose monitoring market and DexCom’s leadership position the company to capitalize on ongoing trends. The combination of strong growth prospects and healthy margins provides the potential for further appreciation.
Options Strategy
Based on this bullish thesis, the OptionsPlay Strategy Center highlights a bull put spread.
- Sell: February 28, 2025, $84 Put at $5.40
- Buy: February 28, 2025, $77 Put at $2.42
- Net Credit: $2.98 per share (or $298 total per contract, since each contract represents 100 shares)
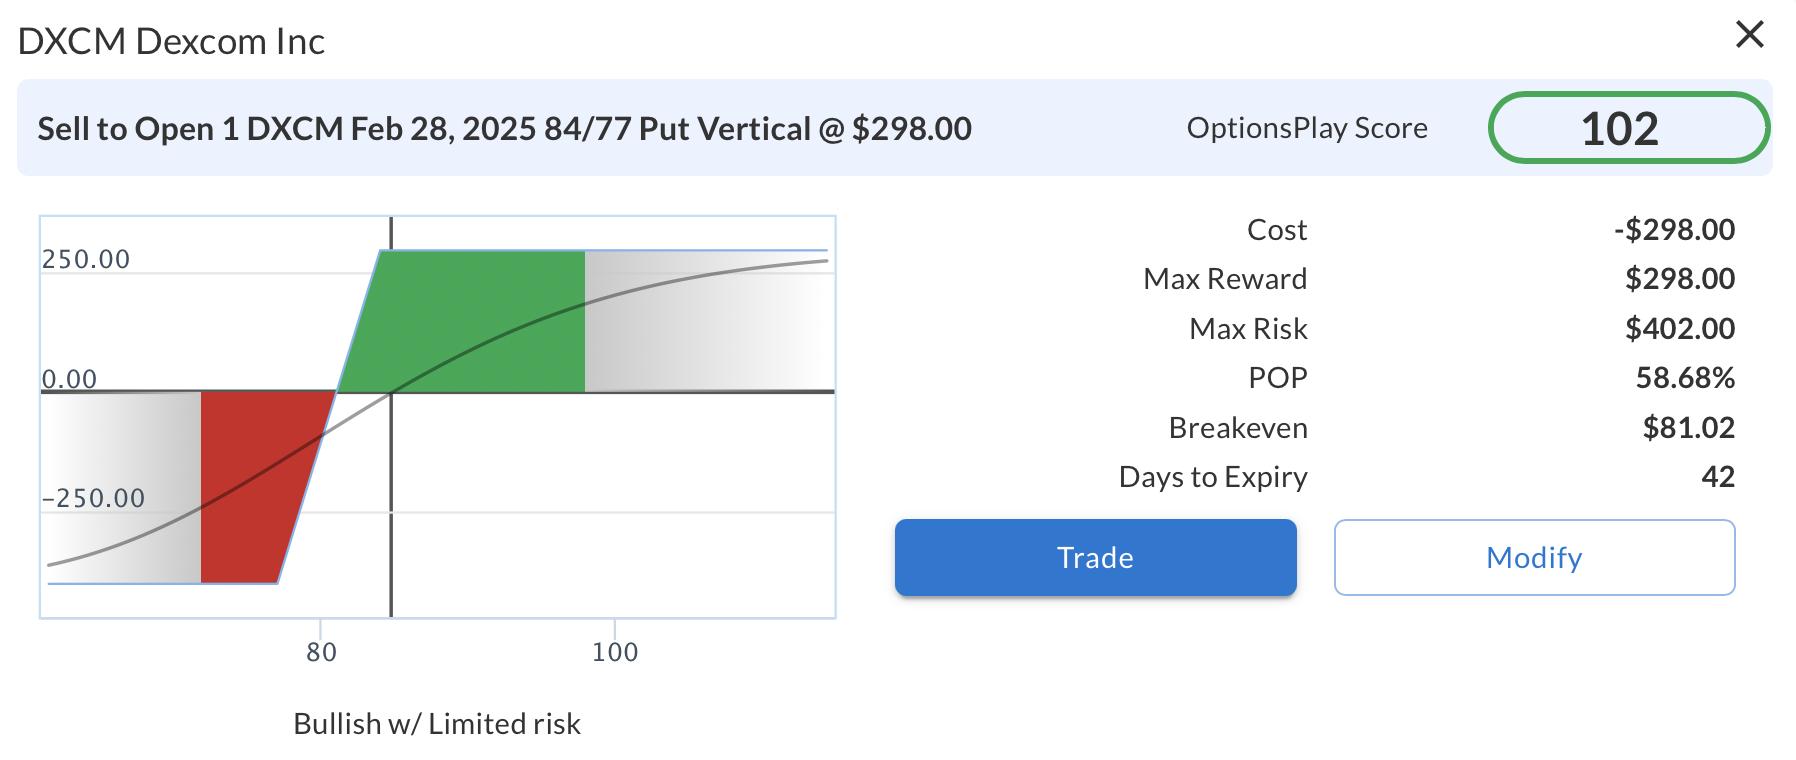
 FIGURE 2. DXCM BULL PUT SPREAD RISK CURVE.
Trade Details
- Maximum Potential Reward: $298
- Maximum Potential Risk: $402
- Breakeven Point: $81.02
- Probability of Profit: 58.58%
This strategy benefits from time decay and a bullish outlook, providing limited risk and a defined reward. At expiration, profits are earned if DXCM’s stock price remains above the breakeven level.
Unlock Real-Time Trade Ideas
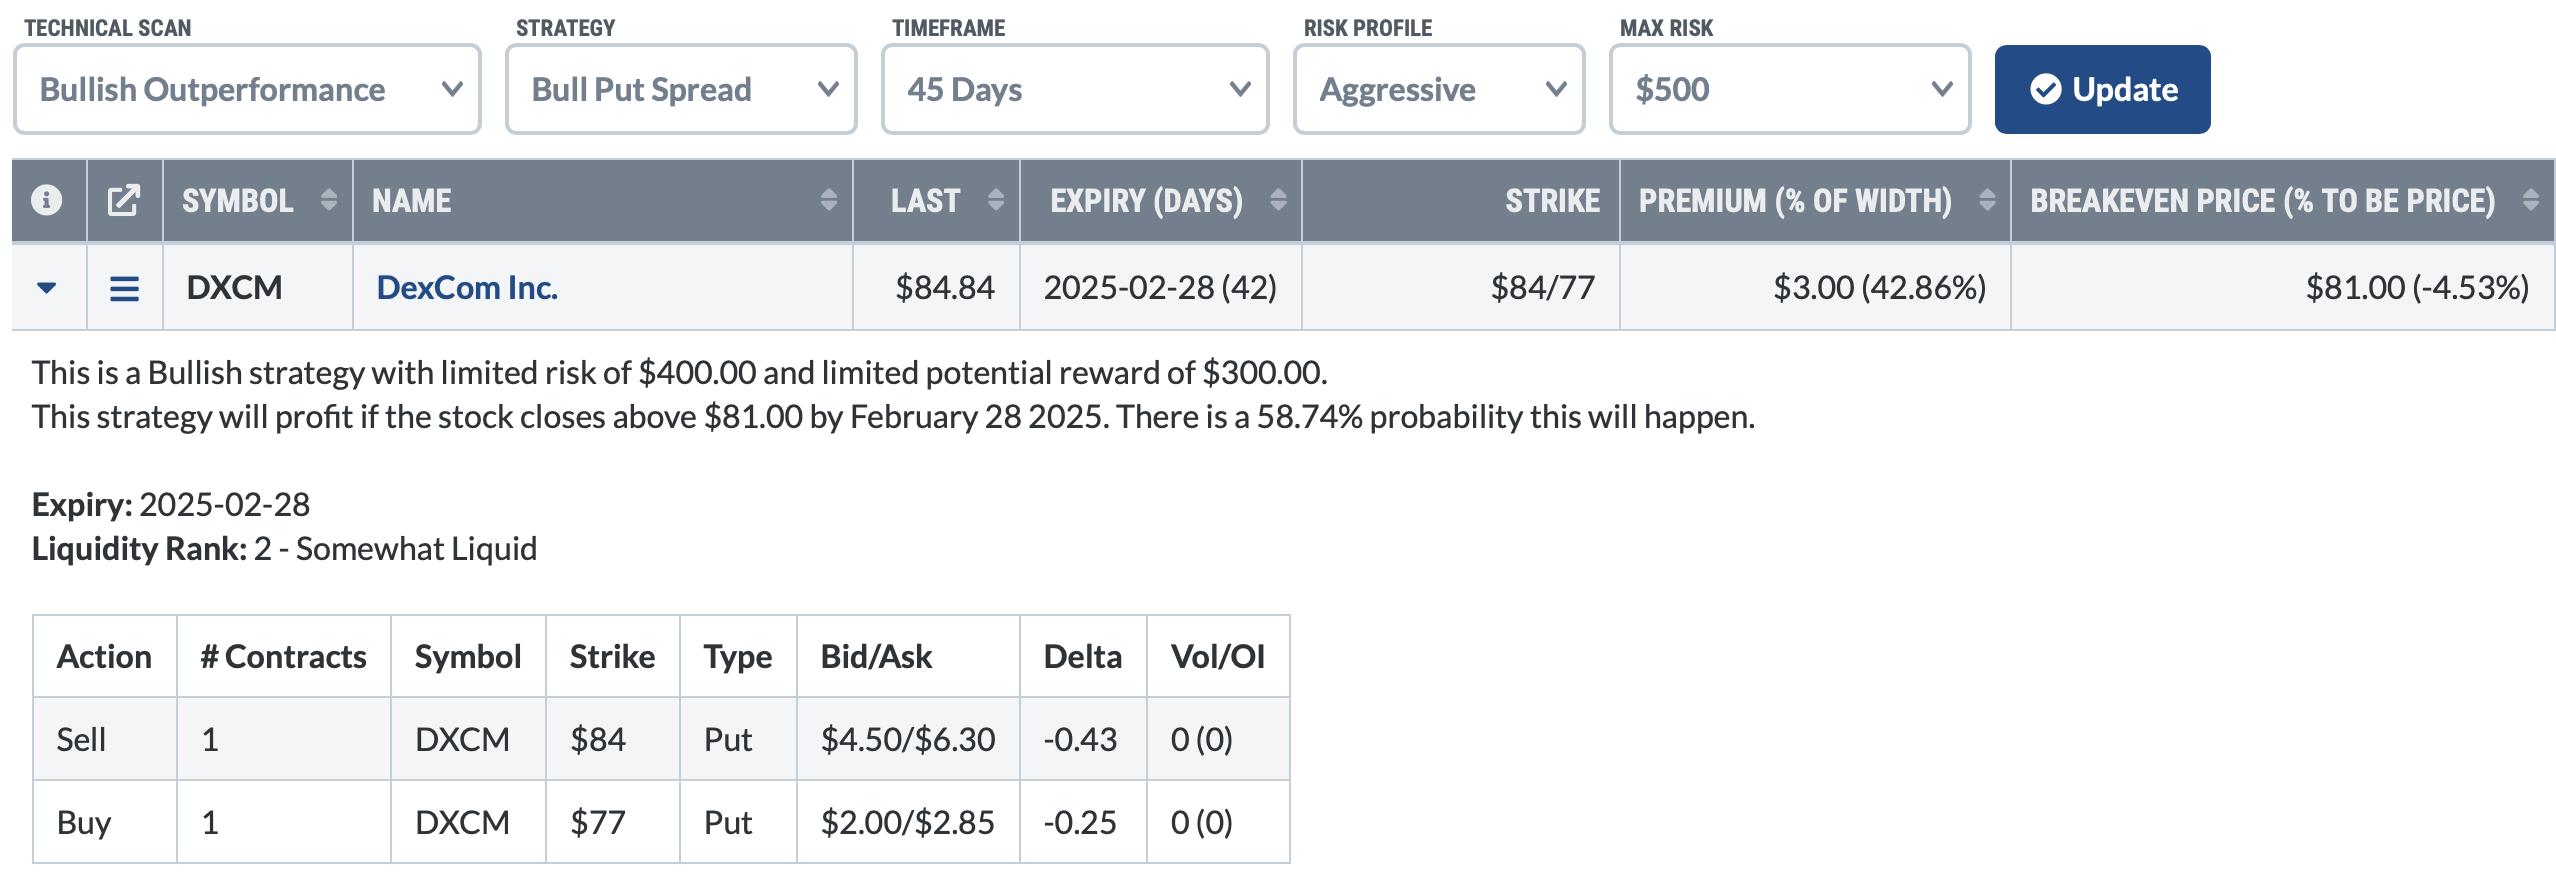
This bullish trade in DXCM was identified using the OptionsPlay Strategy Center within StockCharts.com. The platform’s Bullish Outperform scan (see below) automatically flagged DXCM as the best candidate for selling a Bull Put Spread out of the many stocks currently outperforming the market, then structured the optimal options trade — helping you save hours of research.
 FIGURE 3. BULLISH OUTPERFORMANCE SCAN. DXCM was identified as a candidate for a bull put spread.
By subscribing to the OptionsPlay Strategy Center, you gain access to:
- Automated Market Scans. Quickly discover high-probability trading opportunities based on technical and fundamental signals.
- Optimal Trade Structuring. Receive tailored, real-time options strategies for your market outlook and risk tolerance.
- Time-Saving Insights. Make informed decisions faster, avoiding the time-consuming process of manual analysis.
Don’t miss out on your next high-conviction idea. Subscribe to the OptionsPlay Strategy Center today and unlock a streamlined approach to uncovering the best options trades—all within seconds, every single day. Let OptionsPlay be your strategic ally in navigating the markets efficiently and effectively.

